Global Surface UHI Explorer
Overview
The Global Surface UHI Explorer is an interactive web app to monitor urban heat island (UHI) intensities of practically all urban clusters on Earth. The app is built on the Google Earth Engine platform and allows users to query the UHI data of urban areas using a simple interface. The UHI dataset was created based on the simplified urban-extent (SUE) algorithm detailed in Chakraborty and Lee, 2019.
How to use the app
When you open the app, the map shows the annual mean daytime UHI layer at 1 km resolution derived from a combination of MODIS TERRA and AQUA Land Surface Temperature (LST) data for 2017. You can change the layer to display using the layer selector and change the year for which the UHI is displayed using the slider. You can search for a city or region of interest using the search bar at the top.
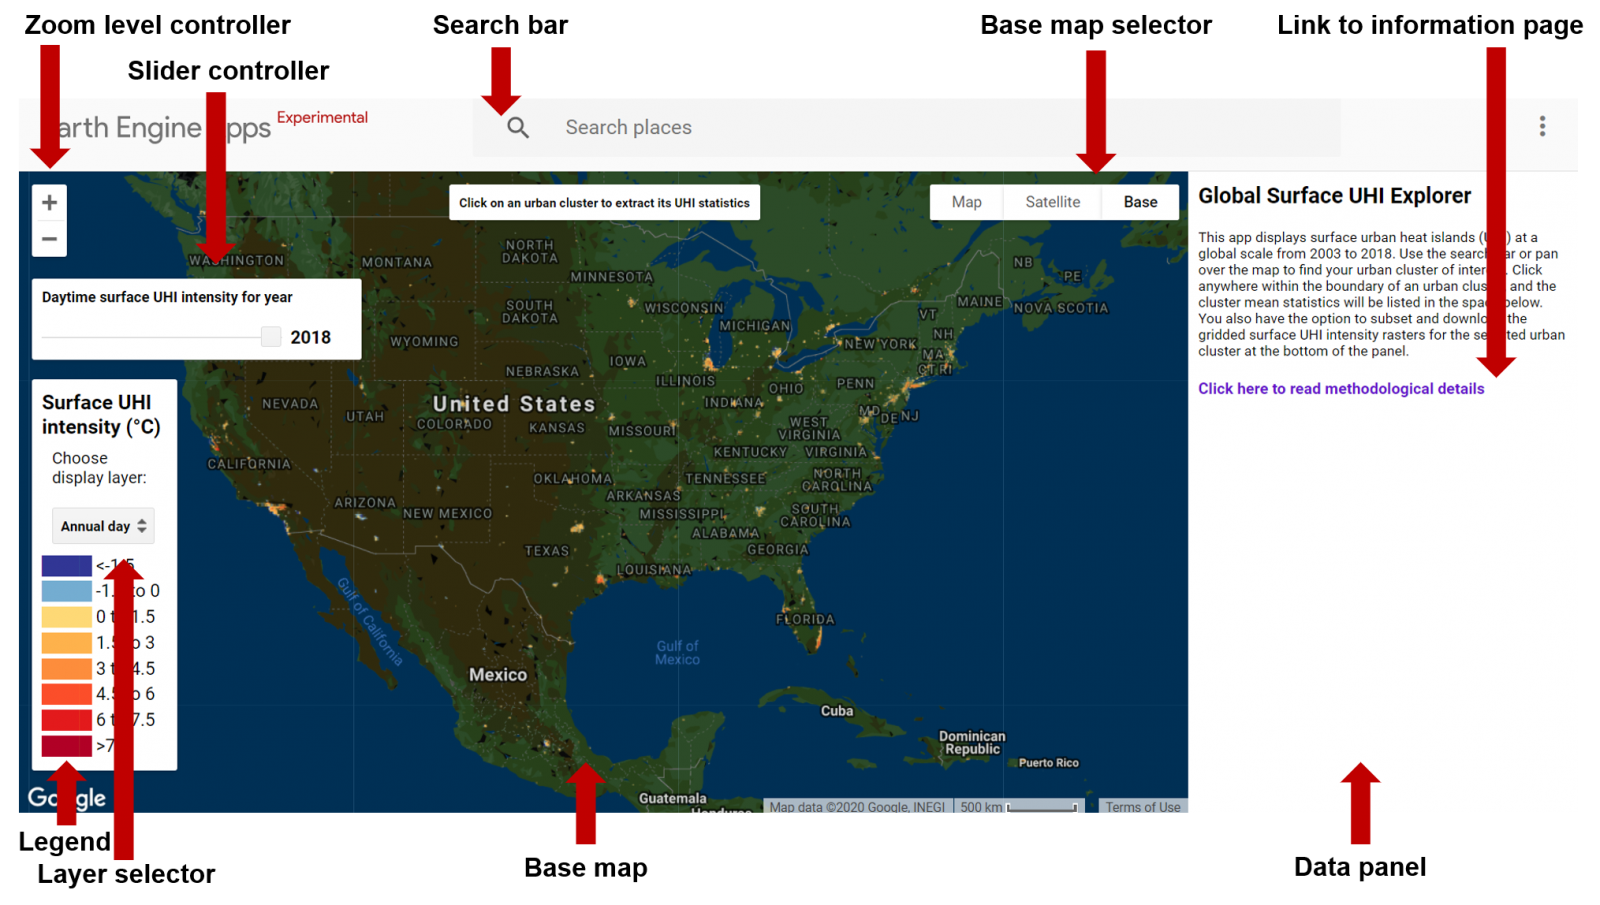
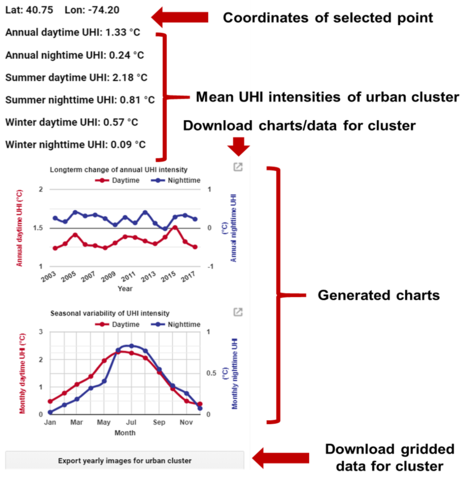 If you click on any of the urban areas, as represented by the colored parts of the layer, you will get the mean annual, summertime, and wintertime UHI intensities averaged over the whole cluster for both daytime and nighttime.
The app also generates two charts for the cluster clicked on: one displaying the change in the UHI intensity from 2003 to 2020, and another showing the monthly variation of the UHI intensity derived from 16 years of MODIS data. You can click on different clusters to extract the corresponding UHI values.
If you click on the top-right corner of the generated charts, you have the option to download the chart in png or svg format or the data in csv format.
Note that if you have access to Google Earth Engine, you can access the dataset directly from its data catalog: https://developers.google.com/earth-engine/datasets/tags/uhi
Updates in version 2
The second version of the dataset represents a more realistic implementation of the SUE algorithm using more recent land use data and leads to a reduction in the mean UHI intensities (by roughly 20%) compared to the version developed in Chakraborty and Lee, 2018. Our methodology has been modified in several ways, namely:
- The European Space Agency Climate Change Initiative (ESA CCI) land cover data are used instead of the MODIS land use/land cover data. In the previous version, urban and rural pixels were chosen on the basis of the MODIS land cover classification (MCD12Q1.051), where urban pixels remain unchanged over the years. In this updated version, urban and rural pixels in each urban cluster are decided on the basis of the ESA land cover classification, which is updated every year and is available at a higher resolution (300 m vs 500 m for MODIS).
- 15-year means (for monthly, annual, summer and winter) are calculated based on the UHI estimates for each year taking into account the land cover data for the corresponding year. Previously, the most recent (2013) MODIS land cover data were used for the calculations, since they did not change over time. This leads to negligible changes in the UHI estimates (<1%).
- Instead of filtering out urban clusters where the mean elevation difference between the urban and non-urban, non-water pixels are greater than 50 m, the rural reference to calculate the UHI was modified by masking out the pixels that have an elevation difference of more than 50 m with the median of the elevation of the urban pixels. In addition, we are no longer filtering out clusters based on percentage of urban area in a cluster. By preventing the filtering out of entire urban clusters and using higher resolution land cover data, this update significantly increases our sample size (from 7374 to 10136).
Updates in version 3
This web app displays and queries the third version of the dataset, an update to the second version. The data are the same, but the app now allows the users to download the gridded UHI data for a selected urban cluster. Scroll down to the bottom of the right-hand panel to extract the datasets for your selection. The masked pixels have a fill value of -999. As also mentioned in the original paper, the SUE algorithm attempts to create a globally consistent UHI database by generalizing the selection of the rural reference. As such, caution should be taken when analyzing the UHI magnitude of individual clusters, especially at the pixel scale.
Updates in version 4
This web app now displays and queries the fourth version of the dataset. The methodology used to create this version remains the same as the third version, but the land cover data used for the years 2016 and 2017 are the recently released year-specific ESA CCI land cover layers for those years (the layer for 2015 was used for 2015, 2016, and 2017 in version 3). In addition, we add the calculated UHI intensity data for 2018 based on the ESA CCI land cover data for that year. The data from 2003 to 2018 are now used to calculate all the yearly, seasonal, and monthly composites.
Updates in version 5
The dataset has now been updated up to the year 2020 using the latest ESA CCI land cover product for the corresponding years.
Limitations and missing data
Note that the UHI calculations by this app are done for urban clusters, not for individual cities. This is because there are a host of issues with delineating urban areas at the city-scale (see Chakraborty and Lee, 2019).
There are two kinds of missing data, either at the cluster-scale or at the pixel scale:
- Cluster-scale missing data are due to the absence of urban and rural pixels (as detected by the ESA CCI land cover product) in a cluster, the lack of any usable pixel in a cluster, or the limitation of the urban extent data used in the algorithm.
- Pixel-scale missing data is due to the limitations of the ESA CCI land cover product (the land cover data may not be valid for every individual city on Earth) or the uncertainty of the MODIS LST data (pixels with >3 °C uncertainty are removed).
Finally, the Landscan urban extent dataset does not change over the years, and thus, cannot account for any change in the footprint of the UHI over the years.
Contact us
Details of the SUE algorithm used to estimate the UHI intensities can be found in Chakraborty and Lee, 2019. If you have any questions or comments about the data, please contact tirthankar.chakraborty@pnnl.gov. This work is licensed under a Creative Commons Attribution 4.0 International License.
If you want to cite this dataset, please use the following reference:
T. Chakraborty, X. Lee, “A simplified urban-extent algorithm to characterize surface urban heat islands on a global scale and examine vegetation control on their spatiotemporal variability”, International Journal of Applied Earth Observation and Geoinformation. 74, 269-280, 2019.