Frequently Asked Questions - MODIS
MODIS is an extensive program using sensors on two satellites that each provide complete daily coverage of the earth. The data have a variety of resolutions; spectral, spatial and temporal. Because the MODIS sensor is carried on both the Terra and Aqua satellites, it is generally possible to obtain images in the morning (Terra) and the afternoon (Aqua) for any particular location. Night time data are also available in the thermal range of the spectrum. You should consider time of day when ordering a scene for a specific day.
The MODIS web site, http://modis.gsfc.nasa.gov/index.php, is a good place to begin learning about this important program. This site has links to the Atmospheres, Land and Oceans groups of MODIS. Place your cursor over the Data tab and you can directly access many of the MODIS products.
MODIS data can be placed in two broad categories; daily scenes and derived products. You can order a daily scene for any specific date and location; and at different times of day and night as mentioned above.
Many consolidated products have been developed from MODIS data. These include 8‑day and 16‑day composite images, a variety of indices, and a range of global products with varying time scales. Products are separated into four science discipline groups. Data for each group may be obtained from specific sites and have unique import techniques described below. You can learn about each group at the following sites:
- Land product information can be found at: https://lpdaac.usgs.gov/dataset_discovery/modis/modis_products_table.
- Atmosphere product descriptions can be found at
http://modis-atmos.gsfc.nasa.gov/products.html - Ocean data can be found at:
http://oceancolor.gsfc.nasa.gov/. - Cryosphere data and descriptions are at the National Snow and Ice Data Center
http://nsidc.org/daac/modis/index.html
Next you need to decide where and when you want data coverage. Locations for full daily scenes and products can be entered using latitude and longitude. If you do not know this information, you could use sites such as Google Earth to locate your area of interest and read the coordinates displayed on the screen. Level 2 processed MODIS data such as the Surface Reflectance products are segmented into tiles with an area of 10º X 10º using a sinusoidal projection. Level 3 products are “gridded” into global datasets.
Dates are in the Julian format, i.e. yyyyddd. There is a Julian Date Converter program on the desktops of the YCEO workstations. Time is in Universal Time Coordinated (UTC). The data are provided in the HDF-EOS format.
Daily MODIS Scenes – Level 1
Individual daily MODIS scenes, MODIS Level 1 products, can be obtained for any part of the earth, every day, since February 2000. These files are in the Geographic projection. A complete dataset has a spatial resolution of 1 km and there are 36 bands of data. The data are distributed as digital numbers in 16 bit unsigned integer format. These data should be converted to radiance values, surface reflectance values, and/or brightness/temperature values before performing any analysis.
Terra file names for a complete file begin with MOD021KM. Aqua file names begin with MYD021KM. The product name on the MODIS ordering site is:
“MODIS/Terra Calibrated Radiances 5-Min L1B Swath 1KM V005”.
In addition you can obtain daily scenes at higher spatial, but lower spectral, resolution. Files with 500m resolution contain the 7 bands of data in the Visible, Near-IR and Mid-IR parts of the spectrum. Files with 250m resolution contain two bands of data in the Red and Near-IR parts of the spectrum. The Terra names for these are MOD02HKM and MOD02QKM respectively.
MODIS Products - Level 2
As mentioned earlier, many products have been developed from MODIS data. You should read the product descriptions for each product you intend to use. This will provide information about data range, scaling values, fill values, data type and format, etc. Product data are generally provided in the sinusoidal projection. Below are short descriptions of the surface reflectance and vegetation products. Many more products are available. While the information below is accurate at the time of writing, you should always read the online USGS metadata for any product you plan to work with.
MODIS Products - Level 3
These MODIS data are gridded into global datasets. You can search for these data at the same sites that MODIS Level 2 products are distributed.
Surface Reflectance Products
The surface reflectance products are generated from the first two, or seven, bands of the corresponding full 36 band scenes. These provide an estimated “at surface” spectral reflectance. Several algorithms are applied to various MODIS bands to remove the effects of cirrus clouds, water vapor, aerosols and atmospheric gases. Global surface reflectance products can be obtained at either 250m with 2 bands or 500m with 7 bands, as daily or 8-day composite images.
The data type is 16 bit signed integer, which has a theoretical range of values from -32,768 to +32,768. The documented data range is from -100 to +16000 with a fill value of -28,672. If you wish to convert these numbers to a valid reflectance data range, cell values should be divided by 10,000. These data must then be stored with a floating point data type.
The data are provided in the HDF-EOS format. MODIS data at version 4 and above use the Sinusoidal projection with the WGS84 datum. A very small sample of common products are listed below.
MOD09GQ - MODIS Surface Reflectance Daily L2G Global 250m
This file has a spatial resolution of 250 m and contains two bands of spectral data centered at 645 nm and 858 nm. There are also three bands of additional information on band quality, orbit and coverage, and number of observations.
MOD09GA - MODIS Surface Reflectance Daily L2G Global 500m
This file has a spatial resolution of 500 m and contains seven bands of spectral data plus three bands of additional information on band quality, orbit and coverage, and number of observations. The spectral range for each band can be found in Appendix A, bands 1 through 7.
MOD09Q1 - MODIS Surface Reflectance 8-Day L3 Global 250m
This file is a composite using eight consecutive daily 250 m images. The “best” observation during each eight day period, for every cell in the image, is retained. This helps reduce or eliminate clouds from a scene. The file contains the same spectral information as the daily file listed above, centered at 645 nm and 858 nm. There is one additional band of data for quality control.
MOD09A1 - MODIS Surface Reflectance 8-Day L3 Global 500m
This file is a composite using eight consecutive daily 500 m images. The “best” observation during each eight day period, for every cell in the image, is retained. This helps reduce or eliminate clouds from a scene. The file contains the same seven spectral bands of data as the daily file listed above. It also has an additional 6 bands of information concerning quality control, solar zenith, view zenith, relative azimuth, surface reflectance 500 m state flags, and surface reflectance day of year.
Vegetation Index Products
There are several composite MODIS vegetation products. Sixteen-day composites are available at 250 m, 500 m, 1 km, and 0.05 degree resolutions. There are also monthly composites with 1 km, and 0.05 degree resolutions. Each file contains bands of data for both the traditional Normalized Difference Vegetation Index (NDVI) and Enhanced Vegetation Index (EVI). There are also data quality bands in each file.
The data type is 16 bit signed integer, which has a theoretical range of values from -32,768 to +32,768. The documented data range is from -2000 to +10000 with a fill value of -3000. If you wish to convert these numbers to the traditional data range, cell values should be divided by 10,000. These data must then be stored with a float data type of IEEE 4 byte real.
The Vegetation Index products have a label prefix of MOD13 for the Terra sensor and MYD13 for the Aqua sensor. On the ordering web page the product name indicates the sensor, composite period, spatial resolution, and data version number. For example, “MODIS/TERRA Vegetation Indices 16-day L3 Global 250m Sin Grid V005” will get you the data from Terra for a 16-day composite at 250 m resolution in the sinusoidal projection using the version 5 data
The USGS has a very good collection of videos on YouTube about their various products. The best place to start is to view the short intro to version 6 data. You will learn about the various products, where to find data, how to use the LP DAAC site.
This first introductory video will be followed by more in-depth videos of various products. These are their “Getting Started with…” videos covering Surface Reflectance, Temperature, Vegetation Indexes, etc.
Individual daily MODIS scenes can be obtained at the Level 1 and Atmosphere Archive and Distribution System (LAADS) at: https://ladsweb.nascom.nasa.gov/search/. The page should open with the 1 Products tab active. In the upper left specify the appropriate sensor(s); Terra, Aqua, or Combined. Then select the MODIS Collection. Currently the most recent is Collection 6.
Below this look for the section Level-0 / Level-1 and click on MODIS Terra, Aqua. This brings up a list of MODIS daily scenes on the right. Select the Level 1B Calibrated Radiances dataset at the spatial resolution you wish.
Click on the 2 Time tab and enter a single date or date range. Normally for Coverage Selection you will select only Day.
Next click on 3 Location and use one of the methods to define your region of interest.
Finally click on 4 Files to make a final image selection.
View the browse images of the datasets that meet your search criteria. After you select the dataset(s) you need, lick the Get Data icon on the bottom toolbar to download your image(s).
While ENVI can import these data directly, you are encouraged to use the MODIS Conversion Tool Kit. Information on it’s use can be found here. If you are working with a 1km file you should process the optical and emissive bands separately; convert the optical bands to Reflectances or convert the emissive bands to Brightness Temperatures. If you do not wish to use the MODIS Conversion Tool Kit then follow the guidelines below.
When working with the MODIS daily scenes you will typically be interested in the Reflectance file and, if you have the 1km resolution dataset, the Brightness Temperature (Emissivity) file. ENVI will convert the provided digital numbers to reflectance or temperature values for you. You must then georeference the dataset to the “Geographic” projection.
- ENVI Standard version 5.2 and all versions of ENVI Classic can easily open and georeference MODIS daily scenes. Instructions for doing this are provided below.
- For ENVI Standard version 5.1 and earlier, and for images that cross the International Date Line, you should use the mctk extension module to ENVI. Check the separate YCEO FAQ for instructions on using the MODIS Conversion Tool Kit.
- Note that as of version 5.2.1 ENVI no longer converts emissivity values to brightness temperature. Users wishing to work with brightness temperature are encouraged to use the MODIS Conversion Tool Kit. Information on it’s use can be found here.
Using ENVI Standard version 5.2
Open a MODIS HDF file from the ENVI main menu File | Open As | EOS | MODIS. The reflectance file is loaded into the Layer Manager and all files are shown in the Data Manager. This includes files for Latitude, Longitude, and Quality. If you get the error message “IDLNARASTER::GETPROPERTY” simply click OK. Explore the scene and examine various band combinations but note that the cell values may not be converted to Reflectance until you save the file when you georeference the image.
From the Toolbox select Geometric Correction | Reproject GLT with Bowtie Correction. Select the input data file you want to work with. Since the File Selection window does not distinguish the types of data, you may need to look at the layer positions in the Data Manager to see if Reflectance is the first, second, or third file in the layer stack.
Click OK and the Reproject GLT with Bowtie Correction dialog window opens. You should change the Interpolation Method to Nearest Neighbor and uncheck Display result. Enter an output file name and location, click OK and wait for the process to complete. When this is done remove the original file from the Layer Manager and load the newly converted and projected MODIS daily scene!
Using ENVI Classic
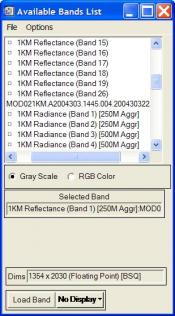 You can use all versions of ENVI Classic to open a MODIS daily scene. From the main menu select File | Open Image File and select your dataset. ENVI automatically converts digital numbers to surface reflectance, radiance, and brightness/ temperature when it opens a full “one kilometer” daily scene. You will see three separate listings in the “Available Bands List” window; identified by band name as Reflectance, Radiance, and Emissive respectively. There will also be one file named Latitude and one Longitude that you can ignore. You typically will only be interested in Reflectance and Temperature (Emissivity) datasets. There will be no data layer for brightness/temperature if using 250m or 500m files.
Initially these files do not display coordinate information, but ENVI can easily generate this. From the main menu select Map | Georeference MODIS. Select a file, click on the “Spectral Subset” button if you wish to use only a few bands of data, and click OK. In the Georeference MODIS Parameters window select the desired output map projection and datum and click OK again. Finally in the Registration Parameters window select a folder and enter a new filename.
Note: ENVI may select the UTM projection by default. Typically these datasets cover an area much larger than a single UTM zone so you should select the Geographic projection and click OK. You can spatially subset and reproject the image later if desired.
When the georeferencing is complete ENVI places a new file with the prefix “Warp” in the Available Bands List. Double click the globe icon to display the coordinate information for this scene. You can view this in a display window and confirm the coordinate information using the Cursor Location/Value tool.
Land Products
A selection of Land products are available at the LAADS site described above in the Daily scenes section. For a more complete collection of MODIS Land products you should search for data at either the GloVIS or Earth Explorer USGS sites or the NASA Earthdata Search site. Each site has a full collection of MODIS Land products along with different collections of other data. They each have a unique interface so the method of identifying the data you desire is a bit different. In each case you will select a location, a product, and a date of interest. You need to create a free account at each site to obtain data.
The USGS GloVis site provides an easy, visual display of each tile to help you select your data. First use the image window in the upper left to navigate to your area of interest and then use the Collections tab to select the MODIS product you want. Once you select the data, click the Add button to place it in your “shopping” cart. When finished selecting data, place the order and you will receive emails confirming the order then providing a link to the data. This is a quick process.
Navigate the USGS Earth Explorer site using tabs along the upper left. Under the Search Criteria tab you are offered several methods to locate your site of interest. You can click a point on the map, manually enter coordinates, or upload a KML or shapefile. From this same screen you can filter the data by time. Next select the Data Sets tab and enter MODIS in the Search box or click on the NASA LPDAAC Collections set to locate your specific data. Click on the Results tab to perform the search and view your results. You can add image footprints to the map and view browse images to help refine your search. You can then immediately download the dataset(s) you wish.
The NASA Earthdata Search site has a good tutorial to help you get started. This will help you easily locate the specific data you need for your project.
Atmosphere Products
NASA has a good site describing MODIS atmospheric products, data formats, content, etc. Your first step should be to review this site:
http://modis-atmos.gsfc.nasa.gov/MOD04_L2/index.html
You can obtain MODIS Atmosphere products from the same LAADS site that MODIS Daily scenes are distributed at: http://ladsweb.nascom.nasa.gov/data/search.html. You should follow the same navigation and search procedures as described in that FAQ, only under Group select Atmosphere Level 2 or Level 3 Products.
Ocean Products
Ocean products have been derived from MODIS, SeaWIFS, and other sensors and are available at the NASA OceanColor site. You should read the descriptions of the products and processing levels before working with these data.
Cryosphere Products
The National Snow & Ice Data Center (NSIDC) is the site to learn about MODIS snow and ice products. They have definitive data descriptions and links to data sources. As with other types of data, please read the data descriptions before downloading any data.
ENVI can open and process most MODIS HDF data. However, the data formats and specific processing steps differ for daily scenes and the various domain products. Daily scenes have geographic coordinate information embedded in the file. Instructions for importing these data are covered in another FAQ. MODIS products are typically distributed using the sinusoidal projection in 10º tiles. Instructions for processing several types of data are described below.
MODIS Land Products
The MODIS Land product data are provided in HDF format using a sinusoidal projection. We recommend using the MODIS Conversion Tool Kit to import these data and reproject to Geographic Lat/Lon if desired as described in another YCEO FAQ.
You can open these directly in ENVI Standard from File | Open As | EOS | MODIS or from ENVI Classic File | Open External File | EOS | MODIS. Select the data layer(s) you wish to use and the new file will be in the sinusoidal projection. Methods for converting the data to the “geographic” projection vary by software version, as described below.
For ENVI Standard version 5.2 in the Toolbox select Raster Management | Reproject Raster. This opens the Reproject Raster dialog window. Browse to the input dataset, then select the Output Coordinate System (Geographic | World | WGS 1984) and finally enter an output filename and click OK.
For ENVI versions 5.1 and earlier you should use ENVI Classic to reproject these data. From the Classic main menu select Map | Convert Map Projection. Another alternative is to use an extension module to ENVI. We recommend using the MODIS Conversion Tool Kit to import these data. This is described in another YCEO FAQ.
MODIS Atmosphere Products
MODIS Atmosphere products are distributed in HDF format as are the Land products. ENVI Standard can open this dataset from File | Open As | EOS | MODIS but it only accesses the reflectance and coordinate files. To access the atmospheric products such as optical depth you are strongly encouraged to open these files using the MODIS Conversion Tool Kit described in another YCEO FAQ.
MODIS Ocean Products
MODIS Ocean products can be opened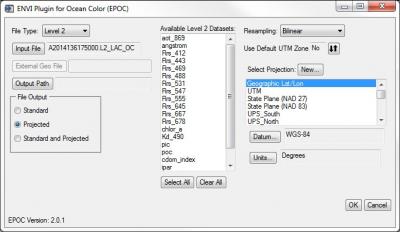 easily in ENVI Standard using the special extension EPOC found in the Toolbox under Extensions. Select the appropriate File Type (Processing Level 1, 2 or 3). Next select the input file and define the output location. For Level 2 or 3 products, choose the appropriate dataset(s) from the available list. Under File Output choose Projected and select the projection Geographic Lat/Lon and click OK to import the new file.
The ENVI Plugin for Ocean Color (EPOC) for ENVI was developed by Devin White. He has graciously made them publicly available on GitHub at: https://github.com/dawhite/ENVIPlugins
MODIS Snow and Ice Products
We recommend using the MODIS Conversion Tool Kit to import these data and reproject to geographic as described in another YCEO FAQ.
Alternatively, if you are using ENVI version 5.2 or above you can open these directly in ENVI Standard from File | Open As | EOS | MODIS or from ENVI Classic File | Open External File | EOS | MODIS. Select the data layer(s) you wish to use and the new file will be in the sinusoidal projection. To convert the data to the “geographic” projection, from the Toolbox select Raster Management | Reproject Raster. This opens the Reproject Raster dialog window. Browse to the input dataset, then select the Output Coordinate System (Geographic | World | WGS 1984) and finally enter an output filename and click OK.
If you are using ENVI version 5.1 or earlier, MODIS Snow and Ice products can be opened as generic HDF files in ENVI Standard from File | Open As | Generic | HDF4. However these files will have no projection or coordinate information.
MODIS Conversion Tool Kit
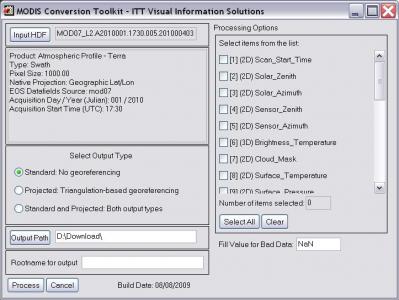 The YCEO Lab uses a plugin module for ENVI to import and convert the projection of many MODIS daily scenes and products in one step. You access the Toolkit from the ENVI Standard interface Toolbox | Extensions | mctk (for ENVI Classic main menu File | Open External File | EOS | MODIS Conversion Toolkit). From the initial Toolkit dialog box click on the Input HDF button and select your file. This opens the expanded Toolkit dialog box.
Under the Processing Options section on the right select the layers of data you wish to import.
Under the Select Output Type section select one of the radio buttons to determine the output coordinate information.
The default, Standard, will retain the sinusoidal tile projection. Selecting Projected will result in an expanded dataset in Geographic projection. You normally would NOT select the third option Both.
Finally enter a Rootname and Output Path for the new dataset.
If you plan to mosaic adjacent tiles you should use the Standard (sinusoidal) Output Type. These sinusoidal tiles can be perfectly joined, whereas the projected data will have gaps at the edges. Once the tiles are mosaicked you can reproject the single seamless file into the Geographic projection.
The MODIS Conversion Tool Kit is one of several plugins for ENVI developed by Devin White. He has graciously made them publicly available on GitHub at: https://github.com/dawhite/ENVIPlugins
The Oak Ridge National Laboratory distributes global subsets of many MODIS land products. The subsets are spatially limited to a maximum of 200 km X 200 km in size but can cover the entire time of the MODIS program. This is an easy way to obtain a time series of data for you research projects.
The data are available at the ORNL DAAC at:
http://daacmodis.ornl.gov/cgi-bin/MODIS/GLBVIZ_1_Glb/modis_subset_order_global_col5.pl
Begin by entering the scene center coordinates or drag the balloon to your location and click the Continue button. Next select one of the many products available. Note that products beginning with “MOD” are from the Tera sensor and “MYD” are from the Aqua sensor. Next enter the number of kilometers Above and Below (north/south) and Left and Right (east/west) that you want for the spatial coverage and hit the Continue button.
On this third page select the beginning and ending times of your requested series. (You should consider selecting a small temporal subset for initial testing before ordering 400+ layers of data.) You are offered a choice of projections, either MODIS Sinusoidal or Geographic Lat/Lon. You should select the Sinusoidal projection; you can reproject the data to a different coordinate system in ENVI later if necessary. Click on the Review Order button. After reviewing your order you can change parameters or click Create Subset to submit the order. You will get an email when this is completed.
Following the link in the email from ORNL brings you to a page with several charts visualizing the data you have selected. After examining these results, click on the Download Data tab and select the Product GeoTIFF Data link to get your data compressed in a “.tar.gz” file. You can use 7-Zip or another utility to extract the data files for your research. Note that this may result in many more files than you expect. For example, the NDVI/EVI Vegetation Index file consists of 22 datasets for each time period. So an order for a two-year cycle of vegetation indexes will produce 528 separate files.
Finally you need to create a single multi-date file containing all of the desired data layers such as NDVI or Land Surface Temperature, making sure the layers are stacked in date order. This can be done easily using a script written with the ENVI programming interface. The YCEO has developed an script that can perform this task for you. See a member of the YCEO staff for a copy of this ENVI script, along with guidance on how to tailor this for your specific needs and execute the script in the IDL environment.
ENVI has more information about programming in their Help section under Contents | Programming | Programming Guide. Also read the short ENVI Programming FAQ on the YCEO site.
The NASA Application for Extracting and Exploring Analysis Ready Samples (AppEEARS) site allows users to access MODIS and Landsat data for selected point locations without the need to actually download these raster datasets. You can manually enter one or more point locations or upload a file of sites for analysis. On the site you can generate charts and graphs of these data individually or in combination, over various time-scales. After exploring the data you can easily download the data for your location(s) as a CSV file.
There are a large number of MODIS and Web Enabled Landsat Data (WELD) products on the site. Users are encouraged to view this USGS YouTube video to learn more about what the site can do, and how to use it. You can also click on the Help link of the AppEEARS page for a short demo of what the site can do and how to use this.