Frequently Asked Questions - ASTER
The ASTER (Advanced Spaceborne Thermal Emission and Reflection Radiometer) sensor is an imaging instrument flown on the Terra satellite which was launched in December 1999. ASTER has been designed to acquire land surface temperature, emisivity, reflectance, and elevation data and is a cooperative effort between NASA and the Japanese Ministry of Economy, Trade, and Industry (METI). As of April 1, 2016 these date are being distributed free of charge.
You can learn more about the ASTER program at: http://asterweb.jpl.nasa.gov/ or view this hour-long NASA ASTER YouTube video.
This document does not cover the 30m ASTER Global Elevation Dataset. You can find information about the ASTER GDEM data in the DEM FAQ on this site.
An ASTER scene covers an area of approximately 60 km by 60 km and data is acquired simultaneously at three resolutions.
VNIR - 15m spatial resolution - 3 bands at Green, Red, and Near InfraRed wavelengths
- for the AST_L1B dataset only, there is also a backward viewing band 3B.
SWIR - 30m spatial resolution - 6 bands between 1.65 and 2.40 micrometers
TIR - 90m spatial resolution - 5 bands between 8.29 and 11.13 micrometers
Note: Since April 2008 the ASTER SWIR sensor has been subjected to abnormally high temperature abnormalities and these bands should not be used. The VNIR and TIR data are fine.
The images are georeferenced to the WGS-84 datum and Universal Transverse Mercator projection. Data are acquired when tasked and the telescopes on the ASTER sensor can be pointed to each side to expand data collection opportunities. As a result, images do not have regular and repeating path and row footprints as many other sensors have. This can provide a challenge when searching for imagery over time.
As of the spring of 2016 the primary full ASTER individual dataset is the AST_L1T: ASTER Level 1 Precision Terrain Corrected Registered At-Sensor Radiance product. The AST_L1T product has a very high level of geometric correction and the scenes are distributed with a North-Up orientation. All prior ASTER scenes have been reprocessed to this data format. A complete ASTER scene consists of 14 bands of data as described above. In addition you can select full resolution browse images in GeoTIFF format suitable for use in GIS programs along with several Quality Assurance files. You should read the USGS AST_L1T product page for full dataset details.
The earlier ASTER version AST_L1B: ASTER Level 1B Registered Radiance at the Sensor product includes the backward viewing NIR band labeled 3B and is delivered in the along-track orientation. These scenes should be rotated so north is up. This is described in the FAQ Importing ASTER with ENVI.
There are several ASTER products derived from individual scenes such as temperature, emissivity, and reflectance. You can view the full list of products, as well as individual product documentation sheets at: https://lpdaac.usgs.gov/dataset_discovery/aster/aster_products_table. Each product has unique scaling factors and fill values that are described in the product documentation. For example, the AST_08 Surface Kinetic Temperature product has a valid data range from 200 to 3200 and must be multiplied by 0.1 to restore the values to degrees Kelvin.
Note: If you are considering working with the AST_07: ASTER Surface Reflectance VNIR and SWIR product prior to April 2008, you may want to consider using the AST_07XT: ASTER Surface Reflectance VNIR and Crosstalk Corrected SWIR product instead. One SWIR band has defective shielding, leading to light leakage to other SWIR bands. This is referred to as Crosstalk. An algorithm has been developed to remove this aberration.
NASA and the USGS both distribute full ASTER Level 1T scenes for immediate download and allow you to place orders for ASTER products. Examples of ASTER products include Surface Reflectance, Temperature, and Elevation. The full list of ASTER products are described at: https://lpdaac.usgs.gov/dataset_discovery/aster/aster_products_table.
You can download full ASTER L1T scenes from several NASA and USGS sites such as the Earthdata Search Client and Earth Explorer sites.
If you are only interested in full L1T ASTER scenes, the USGS Earth Explorer site is very easy to navigate. Go to the Earth Explorer site, select the Data Set tab, then NASA LPDAAC Collections | ASTER Collections | ASTER Level 1T. Next select the location and time range you are interested in. You can also select the ASTER Global DEM product here.
We have several FAQs to help you search and download these data. Please read these separate ASTER FAQs:
- USGS GloVis FAQ - - L1T and Products
- NASA Earthdata Search FAQ - - L1T (Products soon)
GloVis is the USGS Global Visualization Viewer site that is a primary source of data from many sensors. This FAQ only covers ASTER data. Connect to the site at: http://glovis.usgs.gov/. This will use Java to open a data visualization window (it may be behind your current browser window). Note: You must be a registered user to place orders within GLOVIS.
Navigate to your area of interested by entering the Landsat Path/Row, latitude and longitude in decimal degrees, or use the navigation image sliders and click on a location in the interactive map. You may need to zoom in using the Resolution menu, or pan to your specific location. There are typically many images stacked for each location. You can reduce the list by adjusting the percent of maximum cloud cover.
From the Collection menu select the ASTER L1T Day (VNIR/SWIT/TIR) to search for and obtain Level 1T ASTER scenes. (You can select the ASTER L1T Night collection for night-time temperature data.) If you are searching for an ASTER product, then you must select the ASTER L1A Day (VNIR/SWIT/TIR) from the Collection menu. Later in the Shopping Basket you will select the desired product.
For viewing resolutions greater than 155m, the upper-most scene in the display will have a yellow selection box around it. You can right click on this to bring up a menu of options. These include opening a new window to display a larger browse image or detailed metadata. The Select Scene option lists all available data at the specific cursor location. You can select any one of these to bring it to the top of the stack. Images that you are sure you do not want can be hidden to simplify your selection process.
After finding a desired image; click on the Add button or right click the image and select Add to Scene List. When you are done selecting scenes, click on the Send to Cart button to open the Shopping Basket window.
In the Shopping Basket web page you will use the Select Process button to select any ASTER product, or if you want the basic ASTER scene select ASTER Level L1T. Make sure you have selected the Level 1T data or a product based on the L1A selection; you do NOT want the Level 1A data! If you want multiple products for the same scene, you will need to return to the GLOVIS application, reselect the dataset, add it to the shopping cart, and select the processing level. When all data have been selected submit the order for processing. An email will be sent with a link to retrieve the data.
The NASA Earthdata Search application provides an easy way to find ASTER scenes, including ASTER products. ASTER products have additional processing so you will not be able to immediately download these data. You can enter a simple natural language search term such as “Aster temperature over Connecticut for 2017” or follow the guide below for a more targeted search.
Begin by navigating to the Earthdata Search application and click on the Spatial button and select the tool you wish to use to define your area of interest; this can be a rectangle, point, polygon or file. Once you have defined your spatial location, enter ASTER L1T into the search box in the upper left. The number of granules will be displayed in the center panel. You can click on the Temporal tab to apply a time filter to your search and reduce the number of granules selected.
Now you have identified the Where, What, and When for the data you are searching for. Next, in the middle panel click on the Matching Collection to open the Project Collections panel on the left that displays each scene meeting you search criteria. As you move the mouse over each item the actual scene footprint is displayed. Clicking on a scene lets you view browse images. Click on the X to remove scenes that are outside of your area, have too many clouds., or do not meet your project needs for other reasons.
You can retrieve individual scenes (recommended) from the download icon on each scene or you can click on the Retrieve Collection Data button to order the entire collection you are viewing. This could be a large amount of data so make sure you have removed any low-quality scenes and those on the margins of your study area.
The following instructions describe how to open ASTER data using the ENVI 5.x Standard interface. You can perform the same steps in ENVI Classic under the Basic Tools menu. ASTER data sets and products are distributed in the hierarchical data format (HDF). Use the following method to properly open and calibrate these data in ENVI.
- In ENVI 5.3, from the ENVI menu select File | Open As | Optical Sensors | EOS | ASTER.
- In prior versions of ENVI 5.x, from the ENVI menu select File | Open As | EOS | ASTER.
ASTER scenes contain files with three different spatial resolutions. When you open the HDF file the ENVI software creates up to four virtual files for these data. The first contains three VNIR bands with 15m resolution. The second, for L1B data only, is the backward viewing NIR band, also at 15m resolution and rarely used. The next file contains six SWIR bands at 30m resolution. Note that images acquired after April 2008 do not have the SWIR data. Finally the last file contains the five TIR bands at 90m resolution.
In most cases ASTER products have been scaled before archiving at the USGS. Please read the USGS product documentation to determine if these data must be rescaled, and what is the appropriate value.
ASTER L1B data and ASTER products (as of this writing) are delivered in along track orientation and should be rotated to north-up orientation. This is described in the Image Rotation FAQ on this site.
ENVI automatically applies the proper calibration coefficients to convert the integer digital numbers to floating-point radiance values when opening a Level 1B or 1T dataset. You can easily convert these values to Top-Of-Atmosphere Reflectance in ENVI. From the Toolbox select Radiometric Correction | Radiometric Calibration and select the three-band VNIR file. Change the Calibration Type to Reflectance, enter a new filename, and click OK.
ENVI has a multi-step process that can perform basic atmospheric correction then convert the resulting emissivity bands to a brightness-temperature image in degrees Kelvin. When ENVI reads an ASTER AST_L1B scene it calibrates the TIR bands to proper radiance values. If you are working with one of these datasets proceed to Step 2. For the newer ASTER AST_L1T datasets ENVI opens these with “byte values” which must first be converted to floating-point radiance values as shown in Step 1.
Step 1
From the Toolbox select Radiometric Correction | Radiometric Calibration and select the five-band TIR file. Make sure the Calibration Type is Radiance, enter a new filename, and click OK
Step 2
From the Toolbox select Radiometric Correction | Thermal Atmospheric Correction and select as input the five‑band TIR file for AST_L1B datasets or the file created in Step 1 for AST_L1T datasets. In the dialog window take all defaults and enter an output filename to create the input to the Emissivity Normalization process.
Step 3
Again from the Toolbox, select Radiometric Correction | Emissivity Normalization and select the Thermal Correction file just created in Step 2. Take all defaults, make sure the Output Temperature Image is toggled to Yes and enter a filename for this.
You will now have a brightness temperature file with units in degrees Kelvin. You can convert this to Celsius using band math to subtract 273.15 from the file.
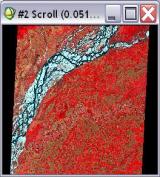
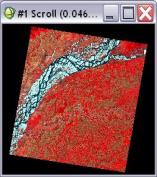
ASTER L1B full scenes and ASTER products (as of this writing) are delivered oriented along the satellite path. While these data are georeferenced, they are NOT oriented with north at the top of the image. These data should be rotated into a map orientation with north being at the top of the image. This step is NOT necessary for ASTER L1T full scenes.
Below are two views of an ASTER dataset illustrating this issue. The left image is aligned to the along-track orientation, the angled path the satellite travels across the face of the earth. The right image has been rotated so north is up.
You should rotate these images to align them so north is up. Prior to performing this you need to check the data values of cells outside of the image, the black or white areas in the margins. This may be something like –NaN or 0 (zero). You will use this value as the background filler value in the next step.
From the Toolbox select Raster Management | Rotate / Flip Data. Accept the default Angle because ENVI extracts the correct rotation angle from the header information. Enter the margin value from above as the new Background value. Then enter a new filename and click OK to rotate the image so that North is Up.